Close
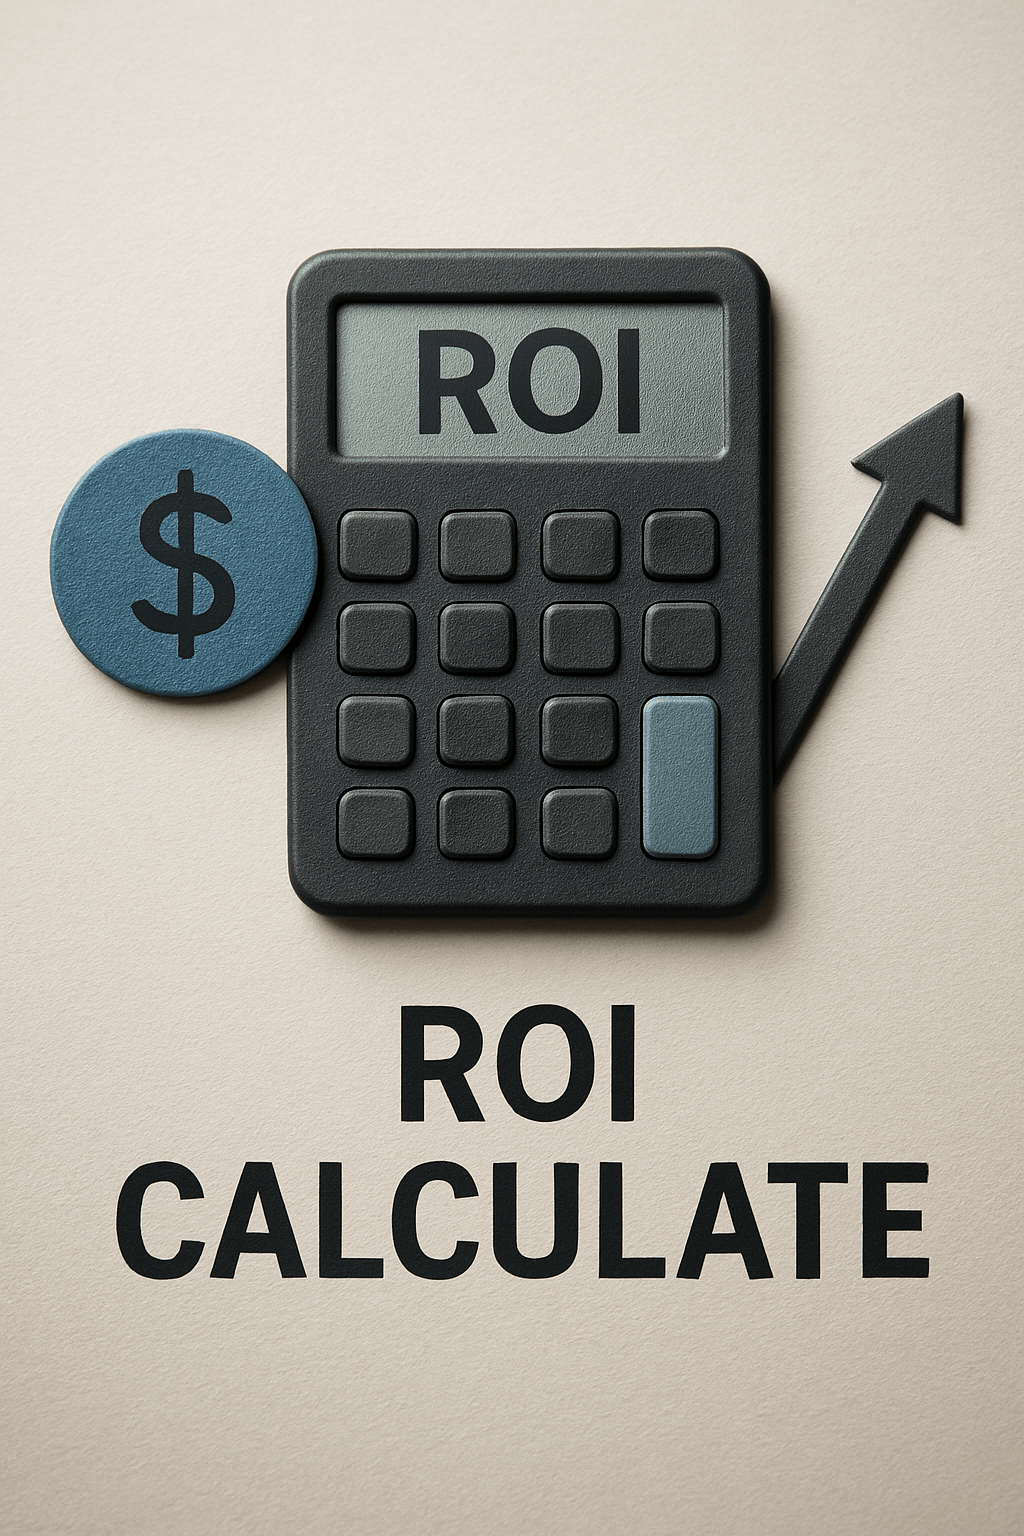
Estimate savings from enhanced asset visibility, license optimization, and reduced operational losses. Our comprehensive calculator helps ITAM and product managers evaluate the financial impact of implementing SoftwarePac’s IT Asset Management solution.
The ROI calculation is built on proven financial models that compare measurable benefits against implementation costs. We analyze five key areas where ITAM delivers quantifiable value:
Reduced hardware loss and misplacement through better tracking
Elimination of unused and over-allocated software licenses
Automated processes reducing manual IT labor hours
Proactive maintenance reducing costly system failures
Reduced audit penalties through accurate reporting
The ROI calculation is built on proven financial models that compare measurable benefits against implementation costs. We analyze five key areas where ITAM delivers quantifiable value:
Start by defining your organization’s current IT asset landscape. These baseline metrics help establish the scope and scale of potential ITAM benefits for your environment
Total number of IT assets under management including laptops, desktops, tablets, and mobile devices
Typical replacement cost per device including hardware, software, and deployment expenses
Percentage of devices lost, stolen, or misplaced annually without proper tracking systems
Number of physical sites requiring asset management and potential downtime monitoring
Default: $600,000 Total yearly expenditure on software licenses, subscriptions, and maintenance across your organization
Default: 15% Estimated percentage of software licenses that are over-allocated, unused, or redundant
Default: $55 Fully-loaded cost per hour for IT staff including salary, benefits, and overhead expenses
Default: 0.4 hours/year Annual time savings per asset through automated tracking, reporting, and maintenance workflows
Default: $2,500 Average cost of system downtime including lost productivity, revenue impact, and recovery expenses. This varies significantly by industry and criticality of systems.
Default: 8 hours per site annually Hours of downtime that can be prevented through proactive asset maintenance monitoring, and lifecycle management.
Default: $50,000 risk, 60% reduction Annual penalty exposure from audit failures and the percentage reduction achievable through accurate ITAM reporting and documentation.
$2.50 per asset per month
$8,000 one-time setup
$3,000 enablement program
These formulas provide the mathematical foundation for implementing the ROI calculator. Each calculation includes conservative default factors based on industry benchmarks.
Formula: (Assets × Avg Cost × Loss Rate) × 0.5 reduction factor
Assumes 50% reduction in losses through improved tracking and accountability
Formula: (Software Spend × Unused %) × 0.6
realization factor
Captures 60% of license waste in year one through optimization and right-sizing
Formula: (Assets × Hours Saved × Hourly Cost
Direct calculation of automation benefits with no
reduction factor applied
Formula: (Downtime Hours × Sites × Cost/Hour) × 0.4 avoidance factor
Conservative 40% reduction in preventable downtime through proactive management
Formula: Compliance Risk × Risk Reduction %
Conservative 40% reduction in preventable downtime through proactive management
Sum of all five savings categories: Hardware loss + License optimization + Labor savings + Downtime avoided + Compliance reduction
Formula: Number of Assets × $2.50 × 12 months
Annual subscription + $8,000 implementation + $3,000 training
Total Annual Benefits minus Total Year-1 Costs
(Net Benefit ÷ Total Costs) × 100
(Implementation + Training) ÷ (Net Benefit ÷ 12)
Most organizations see 150- 300% ROI in year one with payback periods of 6-12 months.
The ROI calculator presents results in an intuitive dashboard format, providing both high-level metrics and detailed breakdowns for stakeholder presentations.
Combined value from all optimization areas
Subscription plus implementation investment
Bottom-line financial impact
No Data Found
Return on investment in first year
No Data Found
Months to recover initial investment
No Data Found
Our calculator uses conservative industry benchmarks to ensure realistic projections. These factors can be adjusted based on your specific environment and implementation approach.
50% factor: Based on tracking improvements from barcode scanning and check-in/out processes
60% factor: Conservative estimate for first-year license optimization capture rate
ROI typically improves in years 2-3 as data quality increases, processes mature, and user adoption reaches full potential. Many organizations see 20-30% improvement in benefit realization after the initial implementation period.
All default factors and assumptions can be tuned to match your organization's specific requirements and risk tolerance.
Our defaults are derived from Gartner research, customer implementations, and conservative industry standards.
Track assets from procurement through disposal with automated workflows and lifecycle alerts
Barcode scanning and mobile app for real-time asset tracking and accountability
Comprehensive software license tracking with usage analytics and optimization recommendations
Automated compliance reports and audit trails for regulatory requirements and vendor audits
See how much your organization can save by reducing asset loss, optimizing licenses, and avoiding downtime with SoftwarePac LLC.
At SoftwarePac LLC, we're committed to transforming businesses of every scale with innovative IT solutions
© Copyright 2025 Softwarepac.com All Rights Reserved